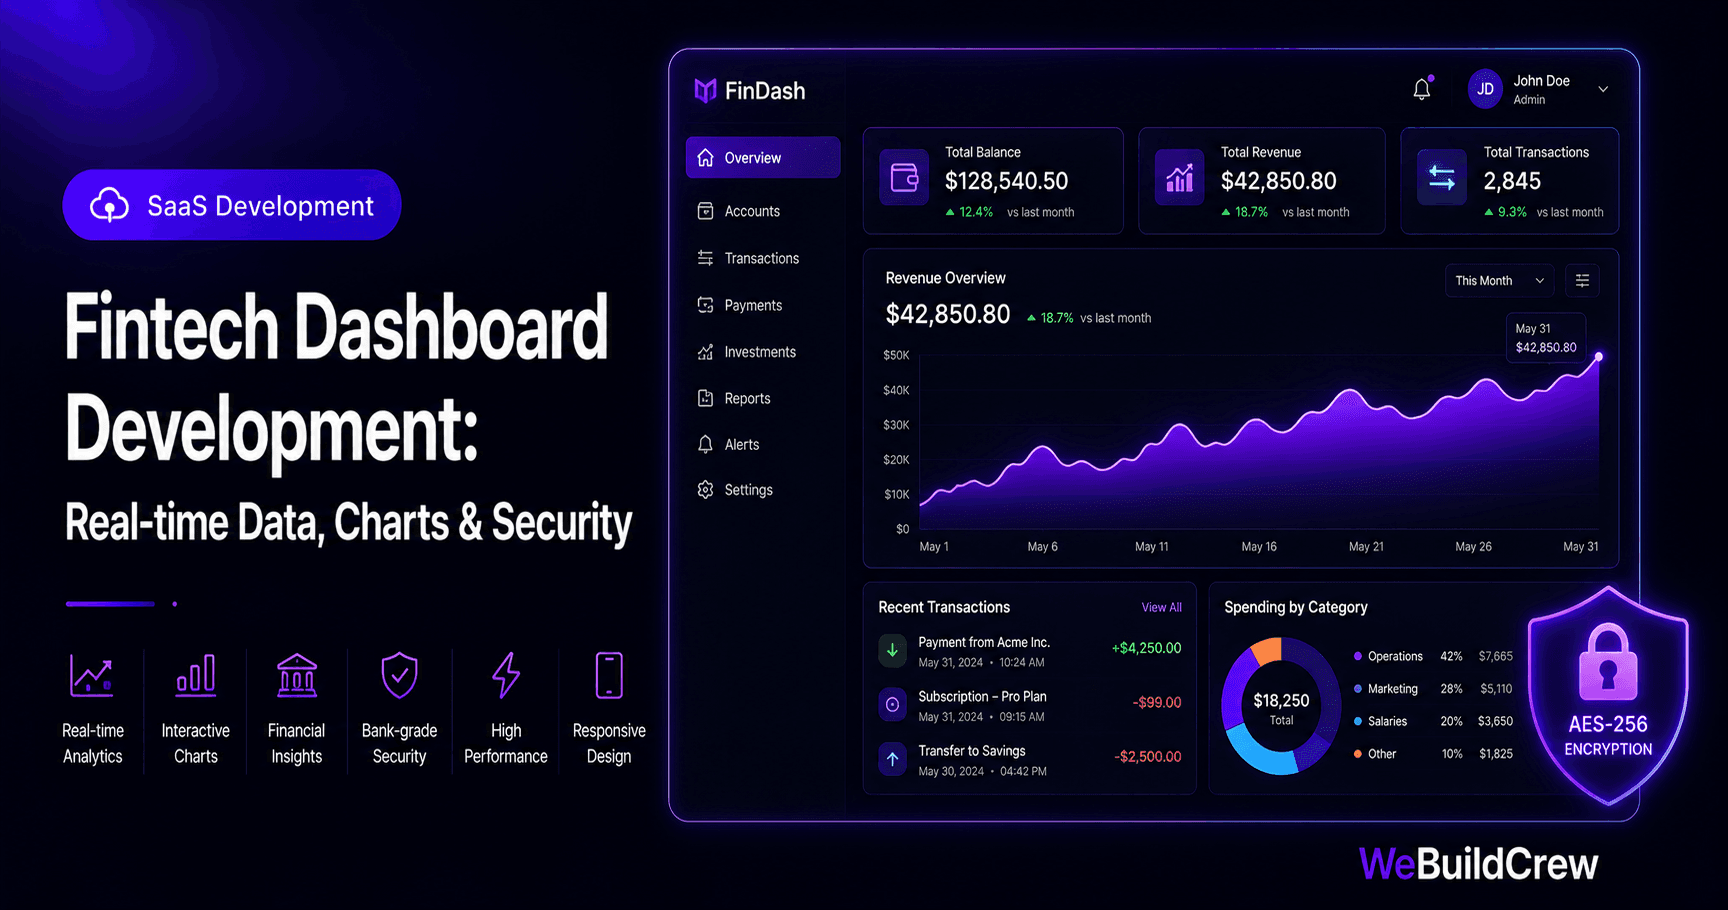
Fintech dashboards have higher stakes than most software: real money is displayed, regulatory requirements are real, and a single security oversight can expose financial data at scale. This guide covers the architecture decisions that keep fintech dashboards fast, accurate and secure.
Real-time financial data
Financial dashboards need data that reflects the current state — not yesterday's batch job. We use a combination of PostgreSQL for historical data and a WebSocket or SSE connection for live updates (new transactions, balance changes) that stream directly to the chart.
Interactive charts that perform
We use Recharts for React (good default) or TradingView's Lightweight Charts for financial-specific needs (candlesticks, volume). The key performance rule: never render more than 1,000 data points client-side. For large datasets, aggregate on the server before sending.
import { AreaChart, Area, XAxis, YAxis, Tooltip, ResponsiveContainer } from "recharts"; export function RevenueChart({ data }: { data: { month: string; revenue: number }[] }) { return ( <ResponsiveContainer width="100%" height={280}> <AreaChart data={data}> <defs> <linearGradient id="rev" x1="0" y1="0" x2="0" y2="1"> <stop offset="5%" stopColor="#9e36ff" stopOpacity={0.3} /> <stop offset="95%" stopColor="#9e36ff" stopOpacity={0} /> </linearGradient> </defs> <XAxis dataKey="month" tick={{ fontSize: 12 }} /> <YAxis tick={{ fontSize: 12 }} /> <Tooltip formatter={(v: number) => `$${v.toLocaleString()}`} /> <Area type="monotone" dataKey="revenue" stroke="#9e36ff" fill="url(#rev)" /> </AreaChart> </ResponsiveContainer> );}Role-based access control
A fintech dashboard typically has: admin (all data, all actions), accountant (read-only with exports), and member (their own transactions only). We model this as a roles table with a permissions array, checked middleware-side before any data query.
Fintech security requirements
- ✓Encrypt sensitive fields at rest (card BINs, account numbers)
- ✓Audit log every data access with user, timestamp and IP
- ✓Rate-limit all financial API endpoints
- ✓2FA mandatory for admin accounts
- ✓Separate read/write database roles — dashboards read from a replica
< 100ms
P99 query
RBAC
Access control
AES-256
Field encryption
audit
Every access logged
Need this built? Explore our SaaS Development service.
View service →Written by Zahid Ghotia · Published 17 June 2026 · 8 min read